Showing posts with label JSONP. Show all posts

August 27, 2013

How to get all your Google Drive folders and URLs with GAS JSONP servlet


Using all the folders of a Google Drive account as a collaboration point over an external web app sounds pretty convenient under certain scenarios, especially for web-based Centralized Business Management.

Apps Script makes this easy with Drive Services and with very little effort you can make a GAS JSONP servlet that query's and packs all the folder names and URLs in a single JSON string, this is specially useful if you are trying to merge different accounts over a single interface. You can get pretty creative about how to implement this.

To make your own GAS JSONP servlet to handle your G.Drive file names & URLs, create a new Google Apps Script project and copy the following code:


Depending on what you need, you might add more data about the folders, this are the most relevant methods:

1.- getAccess(email): Check the users rights on this folder:

2.- getDateCreated(): To know the date when the folder was created.

3.- getDescription(): To get the folders description.

4.- getId(): This one it's particularly useful when working with JSONP, you can use the padding to tell the servlet to do something to a specific folder using the getFolderById(id) method.

5.- getFiles(): It's possible to add all files inside each folder in our JSON package, just add another While cycle but inside the folder's while cycle, this way you get all the folders name, URLs and with all it's files names and URLs, always use parallel loading when using this, in most cases the servlet will take some time to parse all this data.

6.- getSize(): Get's the number of bytes used to store this folder in Drive, in case you need to calculate loads.

Here is a very basic script to call the servlet from your HTML, for testing purposes the prefix it's set to "alert" so the data will be displayed on a pop-up as soon as it loads. For real-life applications change the "alert" prefix to the name of the Javascript function responsible for parsing the JSON, I also recommend
using AngularJS to handle parallel data loading when calling different servlets.


The HTML already includes the URL of a fully working servlet, feel free to use it for testing, but before you can use it, you need to grant access to the servlet, this is a 1 time requirement and it's done by manually calling the servlet's URL:

https://script.google.com/macros/s/AKfycbyixGlm9VJb9RuK_1ZYbsLrduuee4RX2v27mzKvtiFiTm5WaKRK/exec

Stay tuned for articles with more advanced uses of this approach, feel free to post your ideas, comments or suggestions.

Happy coding!

April 4, 2013

How to share/store Spreadsheeds as JSON data with ScriptDB!


There are many cases were we want to share data between many Apps, and one of the most popular ways it's to use Google Spreadsheets as a Central DB, and they do a great job on letting you share, download and access the Database in a very human way, but most of the time we want to efficiently query Data, but with Spreadsheets you need to know which cell has your data, filter using the visualization API or do some parsing... this makes it heavy and slow on large Data sets opposed to ScriptDB who is great for querying specific data!

Another limitation of using Spreadsheets is that they are not very good for handling shared accumulators, it's prone to over-writing when two or more users are working with the same cell at the same time, let's imagine the cell's current value its 3, and both client's add a +1, the cell's value its likely to end up as a 4 instead of 5... To prevent this ScriptDB has 2 different kinds of "locks", one public and one private, the difference is that public only allows 1 instance of the APP to run at any given time and the private lock only allows each USER to run 1 instance of the App at any given time.

Each script project get's a "sandboxed" ScriptDB for it's own use, meaning it's isolated from the rest of the users data and other ScriptDB instances from the same user. But were it really shines it's when you use a single ScriptDB for many Apps as a share point, you just need to create a tiny Apps Script webapp and share it as a library to get shared access to it's ScriptDB... not shiny enough? well, you can create many specific ScriptDBs to make everything safer, and organized by simply creating different library's and calling them as needed (creating different library's allows you to limit specific user's access) ... not enough? well, ScriptDB can be easily transferred to a Spreadsheet for a much more readable long term storage of our data. With some careful planning you can make smart data handling that's its fast, efficient and la piece de resistance... it's all free!

So, which are the limits of ScriptDB? According to the Documentation, they are actually  large enough for most cases, the quotas are per-user (so the limit is shared across all user's Apps, or in the case of the library, it goes against the owner of the library) and it depends on the kind of user:

> 50MB for consumer accounts.
> 100MB for Google Apps accounts
> 200MB for Google Apps for Business/Education/Government accounts.

Since it's all Text data wrapped inside JSON objects, this can be quite a lot of data, even for 50MB. So we are usually more limited to the query limits (default 200, maximum 50,000) and the time limit for an Apps Script instance (maximum 6 minutes processing time), in most cases it's a good idea to dump all the ScriptDB's contents inside an Apps Script sheet or sheets for more comfortable future reference and to avoid saturating the ScriptDB's query's responses.

Also keep in mind that ScriptDB it's specially useful with current and fast changing data, and Spreadsheets its better for long-term storage and for making automatic reports. In most scenarios the best approach it's to create a Sheet everyday with the Date as a name and dump the ScriptDB content on it... Also you can start a new Spreadsheet every month, all automatically and, if done properly, you will end up with a Database that your customers will love for being cheap, fast, flexible and the automatic reports are a great plus (you can even send a custom report via e-mail every time ScriptDB is dumped inside a Sheet).

Without more preamble, let's hit the code! We'll start by creating a Library that returns a ScriptDB instance that can be shared between different apps, create a new script and you only need this 3 simple lines of code!

To use this script as a library, remember you need to write down the script's project key, to get it, go to File - > Project properties.


If you plan to share access to this library with other users, remember to set the "Sharing Settings" which can be found in File - > Share...

To import your library, create (or open) a new Apps Script project and go to Resources - > Manage Libraries and write you Library's project key, inside the "Find a library" box.


Now, it's time to put some JSON data inside our library's ScriptDB! in most cases, we want to get our data from a Spreadsheet either because the Data is already on one, or simply because it is easier to write, as an example let's use the following spreadsheet:

The Apps Script code needed to do this, can be found on this part of the documentation, let's see a copy (with a few modifications):


This will make a flat JSON version of our Spreadsheet inside our shared ScriptDB! Flat JSON is very easy to work with, and remember you can put it back or make a copy in a Spreadsheet at any time.

There is a example code in the documentation to make a quick-check of your ScriptDB content, just create a new script with the following code:


Now you can see the ScriptDB's content by checking the Apps Script Log, our example spreadsheet data would look like this:

{"price":5,"name":"Razor blade","salesToday":0,"onStorage":50}
{"price":2.5,"name":"Toothbrush","salesToday":0,"onStorage":100}
{"price":3,"name":"Liquid Soap","salesToday":0,"onStorage":80}
{"price":3.7,"name":"Shampoo","salesToday":0,"onStorage":80}
{"price":2,"name":"Toothpaste","salesToday":0,"onStorage":150}


Feel free to let us know about your ideas, suggestions, requests, etc at the bottom of this article.


Happy coding!

March 16, 2013

Insights about ScriptDB


ScriptDB it's a great way to store and share JSON data for your Apps Script web apps! It's fast, free, flexible, and also provides plenty storage for most cases.

Let's start by pointing out ScriptDB's performance... inserting, updating and deleting data it's very fast and the time basically depends on the amount of objects we are working with regardless of the overall Database size, being consistent in performance from start and until you fill out your quota makes it suitable for many applications were other approach (like querying data from a large Spreadsheet) are just too slow.

ScriptDB does has a quota (limit), and it's set per user, so the quota space is shared by ALL your web apps. However, it is possible to connect to other user's ScriptDB by sharing Script DB libraries.

ScriptDB's query and storage it's quite flexible for storing and retrieving data from your DataBase. You find data by querying a specific subset of the JSON objects and it has methods that resembles the logical AND, OR and NOT, comparison operators and even facilitates sorting and pagination of the results, all this to allow you to adjust the output to your code's needs.

It also allows you to do the results iterations in many ways, and the one you choose mostly depends on your code's needs and your personal style. It has the  next() & hasnext() methods if you like using While loops or you can use the result.getSize() method if you prefer the For loops.

One last thing I'd like to mention about ScriptDB is it has something called "locks" which are used mostly for certain transactions were you don't want two instances running at the same time (to avoid over-writing) like in accumulators. There are two kinds of locks, public and private. In short, the difference is that public only allows 1 instance of the APP to run at any given time and the private lock only allows each USER to run 1 instance of the App at any given time.

Feel free to post your ideas, suggestions, requests, etc at the bottom of this article.

Happy coding!

February 26, 2013

How to integrate Google Charts, Apps Script JSONP, Spreadsheets & Drive hosted HTML/JS


First things first, it's very easy to draw Charts in your public HTML using the Google Visualization API for Javascript, you can even get help with the code using the Code Playground of the Visualization API, and usually we want to get our data from some Google Spreadsheet, piece of cake...

But things get nasty when you want to use all that juicy flexibility and the data comes from different sources and/or it's "heavy" data that requires local filtering and/or parsing (or simply way too big)... The code get's too large for comfort and too heavy on processor and therefore won't run smoothly on most devices/networks, plus it's a pain to debug or update...

Simply try placing many charts and query data like specific strings and numbers (from the Visualization API) to build some super-cool auto-report on a webpage and it WILL get slow on most devices, plus it will expose all your precious algorithms, code and even some of the structure of your (or your client's) data, even if they don't have the proper OAuth token and Google Account rights to see the actual data, they can get a lot of information just by looking at the public code... And nobody wants any of this (except some curious hackers and opportunist crackers).

Ok, ok.... so what changes with Apps Script? How does it help me to solve all this?. Well, let's mention some of the good stuff:

  • Apps Script handles the query's to Spreadsheets and deliver exactly the data you need ready to visualize inside a Chart, and it does it very fast. 
  • You can leverage client-side broadband/processor needs. 
  • You don't expose the code in the servlets! Nor your keys or ID's, also you can choose who can use the servlet, this all greatly enhance security and privacy. 
  • Different charts needs different views of the data and they all usually need some parsing, you can create one Apps Scipt servlet for each chart, this will make your pre-processing run in parallel on the server side! 
  • You can create one (or many if you handle too much data) servlets to query pieces of specific data like names, values, etc. and pack all that information inside a JSONP object that can be easily broken apart with Javascript to distribute the values across your HTML report page, put some CSS3 in the mix and you can code some nice reports. 
  • Apps Script has far better integration with Google APIs than Javascript plus you code from a cloud editor, so you don't need to install anything, and you enjoy of thing like auto-complete. 
  • You can publish some Scripts as Webapps and use them as library's so you can recycle code and debug/update faster (and safer using the versions systems). 
  • You can easily use/change different data feeds, BigQuery, Cloud Storage, Script DB, etc. without touching the HTML and once it's ready, you just change the version and it will be reflected on your sites instantly. 
  • Google Apps Script, Charts, Visualization API, Spreadsheets, hosting HTML/JS/CSS3, etc. it's FREE. 


Quite a bit right? and one could mention a few more, but this are the "highlights" in my opinion...

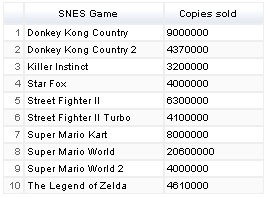
Let's build an example, to keep it "simple" the source will be the most copies sold top 10 SNES games

First we are going to need the data inside a Google Spreadsheet, and we only need the Key of the Spreadsheet for the servlet, this one correspond the the example we will be using:
0AvRClkFMLkcpdGcyWW1xNm83MzlRNXJZS21WSWR3ZUE

Note. For your own spreadsheet to work properly, don't forget to "Publish to the web"

Now let's create a JSONP servlet to query that data and prepare it (if you are not familiar with delivering JSONP content with Google Apps Script maybe you should consider reading this article first).

To prepare data for charts using GAS JSONP servlets, it's best to pack it using Literal Object Notation, it might be tricky to get right at first, but it's much more flexible since it allows you to use the new Data Roles which helps you to create very customized charts, also the visualization engine process Literal Object Notation faster (on the client side) than other 
methods effectively placing most processing work on the server side so you can process in parallel the data you need for the charts before passing it your HTML (feel free to read more about the JavaScript Literal Initializer for Google Charts in the documentation here and here).

First let's take a look at how our example Spreadsheet would look like once it's transformed into Literal Object notation:


{
cols: [
{id: "null", label: "SNES Game", type: "string"},
{id: "null", label: "Copies sold", type: "string"}
],
rows: [
{c:[{v: "Donkey Kong Country"},{v: "9000000"}]},
{c:[{v: "Donkey Kong Country 2"},{v: "4370000"}]},
{c:[{v: "Killer Instinct"},{v: "3200000"}]},
{c:[{v: "Star Fox"},{v: "4000000"}]},
{c:[{v: "Street Fighter II"},{v: "6300000"}]},
{c:[{v: "Street Fighter II Turbo"},{v: "4100000"}]},
{c:[{v: "Super Mario Kart"},{v: "8000000"}]},
{c:[{v: "Super Mario World"},{v: "20600000"}]},
{c:[{v: "Super Mario World 2"},{v: "4000000"}]},
{c:[{v: "The Legend of Zelda"},{v: "4610000"}]}
]
}


After looking at it, one notices that it will require to be parsed in two different parts, one for cols (which contains the column names) and another for rows (which contains the data inside the cells of each row).


First let's build the code for what I like to call the "canvas" of the Object Literal Notation along with the data we are going to need for the parsing jobs:

function doGet(request) {
 var ss = SpreadsheetApp.openById('0AvRClkFMLkcpdGcyWW1xNm83MzlRNXJZS21WSWR3ZUE');
 
 var data = ss.getSheetByName('SNES top 10');
 var columnsContent = [];
 var rowsContent = [];
 var columnsNumber = data.getLastColumn();
 var rowsNumber = data.getLastRow();
 
 return ContentService.createTextOutput(
   request.parameters.prefix + '({ cols: [' + columnsContent + '], rows: [' + rowsContent + '] })')
   .setMimeType(ContentService.MimeType.JSON);
}


This would parse the following output (the "canvas" for Object Literal Notation):

undefined({ cols: [], rows: [] })

Now let's build the code for parsing the cols:


// Columns
for (var i = 1; i <= columnsNumber; i++) {
var columnContent = [];
columnContent = '{id: "null", label: "' + data.getRange(1, i).getValue() + '", type: "string"}';
columnsContent.push(columnContent);

}


This would parse the following output for our example:


{id: "null", label: "SNES Game", type: "string"},
{id: "null", label: "Copies sold", type: "string"}


Now let's build the code for parsing the rows:


// Rows
 for (var i = 2; i <= rowsNumber; i++) {
   var rowObjects = [];
   for (var j = 1; j <= columnsNumber; j++) {
     var cellContent = [];
     var cellContent = '{v: "' +  data.getRange(i, j).getValue() + '"}';
     rowObjects.push(cellContent);
   }
   var rowContent = [];
   rowContent = '{c:[' + rowObjects + ']}';
   rowsContent.push(rowContent);
 }


This would parse the following output for our example:

{c:[{v: "Donkey Kong Country"},{v: "9000000"}]},
{c:[{v: "Donkey Kong Country 2"},{v: "4370000"}]},
{c:[{v: "Killer Instinct"},{v: "3200000"}]},
{c:[{v: "Star Fox"},{v: "4000000"}]},
{c:[{v: "Street Fighter II"},{v: "6300000"}]},
{c:[{v: "Street Fighter II Turbo"},{v: "4100000"}]},

{c:[{v: "Super Mario Kart"},{v: "8000000"}]},
{c:[{v: "Super Mario World"},{v: "20600000"}]},
{c:[{v: "Super Mario World 2"},{v: "4000000"}]},
{c:[{v: "The Legend of Zelda"},{v: "4610000"}]}


Now let's put it all together and see how it looks: 


function doGet(request) {
var ss = SpreadsheetApp.openById('0AvRClkFMLkcpdGcyWW1xNm83MzlRNXJZS21WSWR3ZUE');
 var data = ss.getSheetByName('SNES top 10');
 var columnsContent = [];
 var rowsContent = [];
 var columnsNumber = data.getLastColumn();
 var rowsNumber = data.getLastRow();

// Columns
 for (var i = 1; i <= columnsNumber; i++) {
var columnContent = [];
columnContent = '{id: "null", label: "' + data.getRange(1, i).getValue() + '", type: "string"}';
columnsContent.push(columnContent);
 }

// Rows
 for (var i = 2; i <= rowsNumber; i++) {
   var rowObjects = [];
   for (var j = 1; j <= columnsNumber; j++) {
     var cellContent = [];
     var cellContent = '{v: "' +  data.getRange(i, j).getValue() + '"}';
     rowObjects.push(cellContent);
   }
   var rowContent = [];
   rowContent = '{c:[' + rowObjects + ']}';
   rowsContent.push(rowContent);
 }

 return ContentService.createTextOutput(
   request.parameters.prefix + '({ cols: [' + columnsContent + '], rows: [' + rowsContent + '] })')
   .setMimeType(ContentService.MimeType.JSON);
}


And that's it! You can check the output of our example if you click on it's published link:

https://script.google.com/macros/s/AKfycbwFbraExcWCt9dBWdG2th8M_AaBXY_YJEli7pFYVDytxPRcUYGg/exec

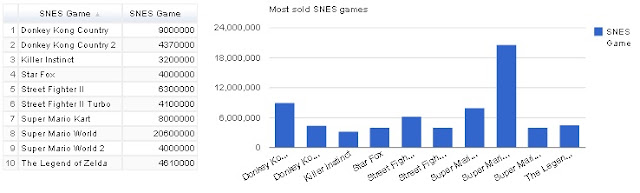
Since the Google Visualization API supports Object Literal Notation natively, there is no need for parsing, just pass the data to a function and put it inside a DataTable for charts to draw, for example:

Javascript:


function OLNtoChart(OLNdata){
var data = new google.visualization.DataTable(OLNdata);
var tableChart = new google.visualization.Table(document.getElementById('tableChart'));
tableChart.draw(data, {showRowNumber: true});
}


HTML:

<id="tableChart"></>
<script type="text/javascript" src="https://script.google.com/macros/s/AKfycbwFbraExcWCt9dBWdG2th8M_AaBXY_YJEli7pFYVDytxPRcUYGg/exec?prefix=OLNtoChart"></script>


You can check how to draw more interesting charts in the Google Charts webpage. Feel free to post your ideas, suggestions, requests, etc at the bottom of this article.


Here you can see a fully working example published on Google Drive HTML hosting:


Happy coding!